1.背景
最近有个同学说他的服务刚启动就收到两次 Full GC 告警, 按道理来说刚启动,对象应该不会太多,为啥会触发 Full GC 呢?
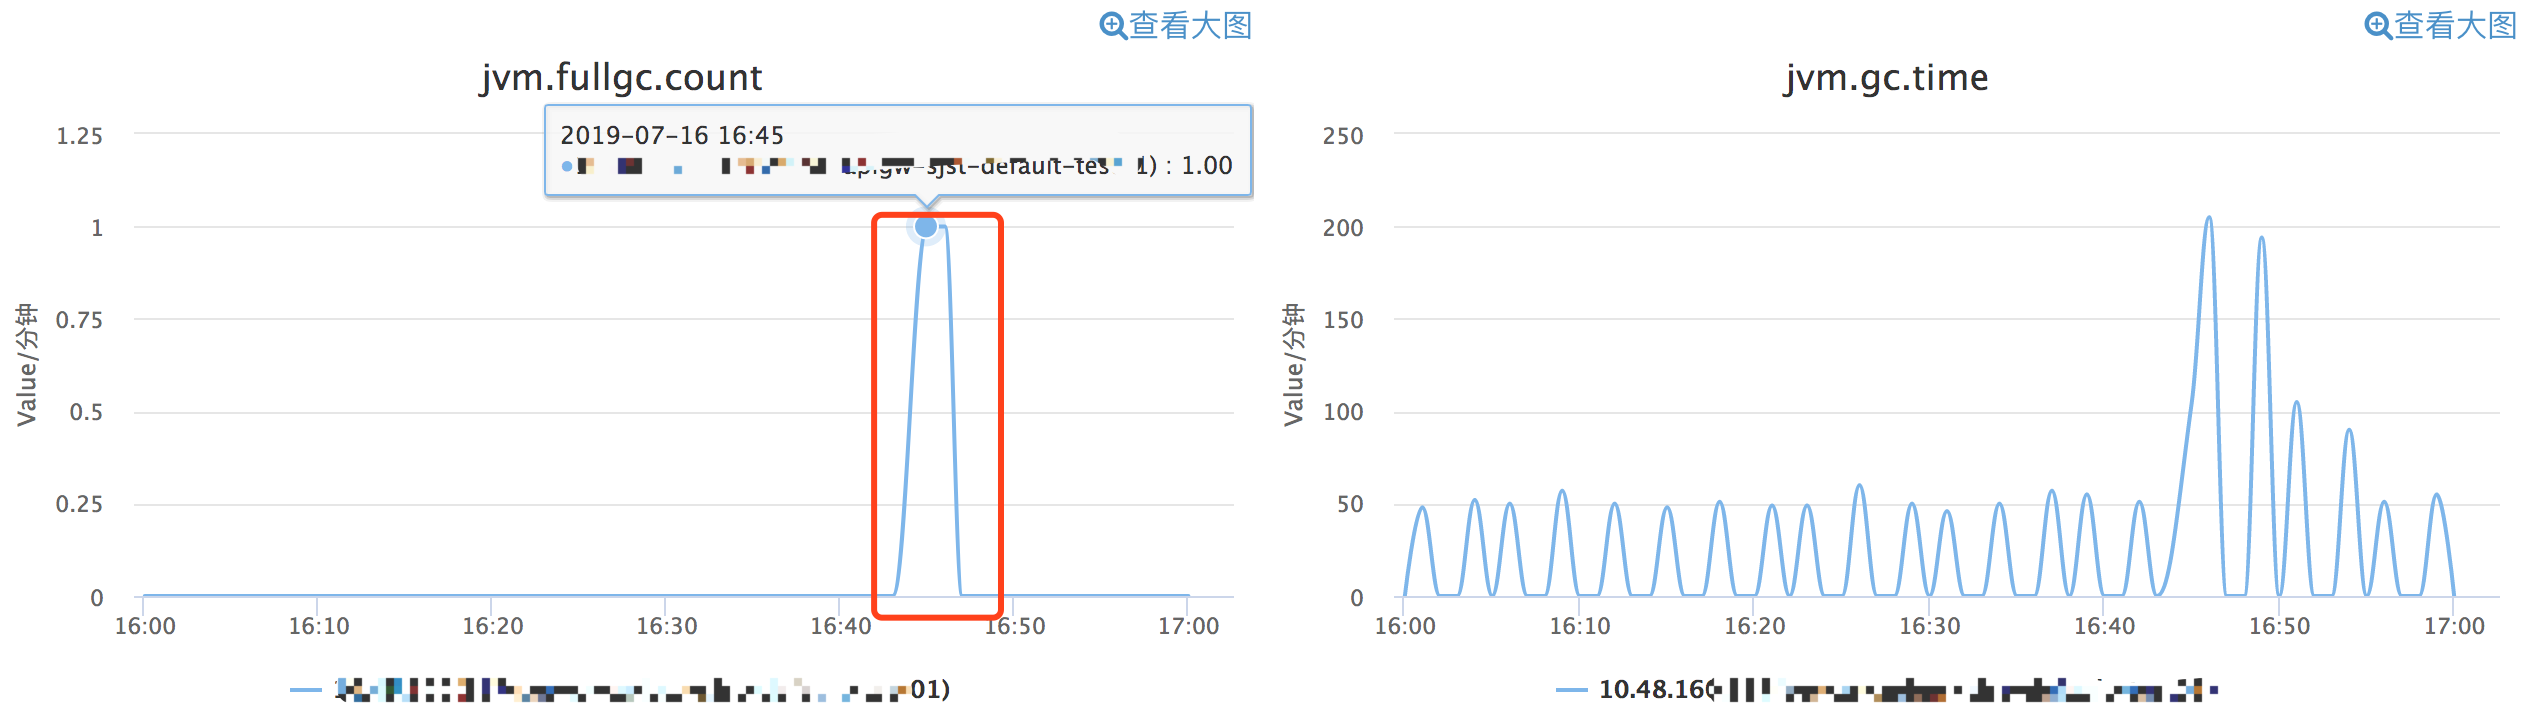
带着疑问,我们还是先看看日志吧,毕竟日志的信息更多。
2.日志
可以看到,其实是两次 CMS GC(监控对 Full GC 和 Old GC 不分)。但是你会发现一个奇怪的现象,咦,”CMS-initial-mark: 0K(3222528K)” 怎么 Old Gen 对象使用空间大小为 0,细想服务刚启动,Old Gen 为 0 也算正常,但是为什么会触发CMS GC 呢? 第一次 CMS GC 日志:
2019-07-16T16:44:56.270+0800: 8.446: [GC (CMS Initial Mark) [1 CMS-initial-mark: 0K(3222528K)] 1477124K(5152832K), 0.0445445 secs] [Times: user=0.16 sys=0.00, real=0.05 secs]
2019-07-16T16:44:56.315+0800: 8.490: [CMS-concurrent-mark-start]
2019-07-16T16:44:56.337+0800: 8.513: [CMS-concurrent-mark: 0.022/0.022 secs] [Times: user=0.03 sys=0.00, real=0.02 secs]
2019-07-16T16:44:56.337+0800: 8.513: [CMS-concurrent-preclean-start]
2019-07-16T16:44:56.343+0800: 8.518: [CMS-concurrent-preclean: 0.006/0.006 secs] [Times: user=0.00 sys=0.00, real=0.01 secs]
2019-07-16T16:44:56.343+0800: 8.518: [CMS-concurrent-abortable-preclean-start]
CMS: abort preclean due to time 2019-07-16T16:45:01.469+0800: 13.644: [CMS-concurrent-abortable-preclean: 1.189/5.126 secs] [Times: user=4.76 sys=0.14, real=5.12 secs]
2019-07-16T16:45:01.469+0800: 13.645: [GC (CMS Final Remark) [YG occupancy: 389472 K (1930304 K)]13.645: [Rescan (parallel) , 0.0113744 secs]13.656: [weak refs processing, 0.0001506 secs]13.656: [class unloading, 0.0050100 secs]13.661: [scrub symbol table, 0.0027502 secs]13.664: [scrub string table, 0.0005121 secs][1 CMS-remark: 0K(3222528K)] 389472K(5152832K), 0.0210563 secs] [Times: user=0.07 sys=0.00, real=0.02 secs]
2019-07-16T16:45:01.490+0800: 13.666: [CMS-concurrent-sweep-start]
CMS: Large Block: 0x00000006fb520000; Proximity: 0x0000000000000000 -> 0x00000006fb51fac8
CMS: Large block 0x00000006fb520000
2019-07-16T16:45:01.490+0800: 13.666: [CMS-concurrent-sweep: 0.000/0.000 secs] [Times: user=0.00 sys=0.00, real=0.00 secs]
2019-07-16T16:45:01.490+0800: 13.666: [CMS-concurrent-reset-start]
2019-07-16T16:45:01.504+0800: 13.680: [CMS-concurrent-reset: 0.014/0.014 secs] [Times: user=0.02 sys=0.01, real=0.02 secs]
第二次 CMS GC 日志:
2019-07-16T16:45:37.496+0800: 49.672: [GC (CMS Initial Mark) [1 CMS-initial-mark: 0K(3222528K)] 1451537K(5152832K), 0.0575060 secs] [Times: user=0.22 sys=0.01, real=0.06 secs]
2019-07-16T16:45:37.554+0800: 49.730: [CMS-concurrent-mark-start]
2019-07-16T16:45:37.576+0800: 49.751: [CMS-concurrent-mark: 0.022/0.022 secs] [Times: user=0.03 sys=0.00, real=0.02 secs]
2019-07-16T16:45:37.576+0800: 49.752: [CMS-concurrent-preclean-start]
2019-07-16T16:45:37.582+0800: 49.758: [CMS-concurrent-preclean: 0.007/0.007 secs] [Times: user=0.01 sys=0.00, real=0.01 secs]
2019-07-16T16:45:37.582+0800: 49.758: [CMS-concurrent-abortable-preclean-start]
 CMS: abort preclean due to time 2019-07-16T16:45:42.639+0800: 54.814: [CMS-concurrent-abortable-preclean: 3.307/5.056 secs] [Times: user=4.63 sys=0.09, real=5.05 secs]
2019-07-16T16:45:42.639+0800: 54.815: [GC (CMS Final Remark) [YG occupancy: 1528656 K (1930304 K)]54.815: [Rescan (parallel) , 0.0710980 secs]54.886: [weak refs processing, 0.0003495 secs]54.887: [class unloading, 0.0158867 secs]54.903: [scrub symbol table, 0.0065509 secs]54.909: [scrub string table, 0.0008214 secs][1 CMS-remark: 0K(3222528K)] 1528656K(5152832K), 0.0980449 secs] [Times: user=0.30 sys=0.01, real=0.10 secs]
2019-07-16T16:45:42.738+0800: 54.913: [CMS-concurrent-sweep-start]
CMS: Large Block: 0x00000006fb520000; Proximity: 0x00000006fb51fac8 -> 0x00000006fb51fac8
CMS: Large block 0x00000006fb520000
2019-07-16T16:45:42.738+0800: 54.913: [CMS-concurrent-sweep: 0.000/0.000 secs] [Times: user=0.00 sys=0.00, real=0.00 secs]
2019-07-16T16:45:42.738+0800: 54.913: [CMS-concurrent-reset-start]
2019-07-16T16:45:42.745+0800: 54.921: [CMS-concurrent-reset: 0.007/0.007 secs] [Times: user=0.01 sys=0.00, real=0.01 secs]
之前我整理过一篇《JVM 源码解读之 CMS GC 触发条件》 )文章,其中提到很多种 CMS GC 触发条件,我们来一起来分析下吧。
3.分析
首先,这必然是 CMS 的 background collector。因为 foreground collector 触发条件比较简单,一般是遇到对象分配但空间不够,就会直接触发 GC。但是 Old Gen 占用为 0,不可能申请时空间不足。因此,可以断定是 CMS 的 background collector。另外, foreground collector 是没有 Precleaning、AbortablePreclean 阶段的,因此,从 CMS GC 日志上来看,也能看出是 background collector。
既然是 CMS background collector,我们结合 JVM 参数及日志,再按照 background collector 的五大种情况一个个的排除呗。
-XX:+UseConcMarkSweepGC -XX:+UseParNewGC -Xms5114m -Xmx5114m -XX:MaxNewSize=1967m -XX:NewSize=1967m
-XX:SurvivorRatio=22  -XX:PermSize=384m -XX:MaxPermSize=384m -Xss512k -XX:OldPLABSize=16
-XX:+UseCMSCompactAtFullCollection -XX:+UseCMSInitiatingOccupancyOnly -XX:CMSFullGCsBeforeCompaction=0 -XX:CMSInitiatingOccupancyFraction=75
-XX:InitialCodeCacheSize=128m -XX:+PrintClassHistogram -XX:PrintFLSStatistics=1 -XX:+PrintGC -XX:+PrintGCDateStamps -XX:+PrintGCDetails
-XX:+PrintGCTimeStamps -XX:+PrintHeapAtGC -XX:+PrintPromotionFailure -XX:+PrintTenuringDistribution
-XX:ReservedCodeCacheSize=128m -XX:+StartAttachListener -XX:+UseCompressedClassPointers
-XX:+UseCompressedOops -XX:+DisableExplicitGC
根据是否是并行 Full GC 这种一般是由 System.gc 触发的 Full GC,且在配置了 ExplicitGCInvokesConcurrent 参数的情况下,进而将 Full GC 转成并行的 CMS GC。可以看到 JVM 配置并无此参数,而且还配置了 DisableExplicitGC 参数,它会屏蔽 System.gc。因此,排除这类情况。
根据统计数据动态计算(仅未配置 UseCMSInitiatingOccupancyOnly 时) 直接排除吧,因为 JVM 配置了 UseCMSInitiatingOccupancyOnly 参数。
根据 Old Gen 占用情况判断 这种情况主要是 Old Gen 空间使用占比情况与阈值比较,从 JVM 配置可以看到 CMSInitiatingOccupancyFraction=75 阈值设置的是 75%,目前 Old Gen 还是 0 呢,显然不符合。
根据增量 GC 是否可能会失败(悲观策略) 这种情况主要说的是在两代的 GC 体系中,如果 Young GC 已经失败或者可能会失败,JVM 就认为需要进行一次 CMS GC。我们看日志也知道,并无此类情况发生,而且 Old Gen 剩余空间还非常大,比整个 Young Gen 都大。
根据 metaspace 情况判断 这是最后一种情况了,这里主要看 metaspace 的 should_concurrent_collect 标志,这个标志在 metaspace 进行扩容前如果配置了 CMSClassUnloadingEnabled 参数时,会进行设置。咋一看,JVM 参数貌似没设置这个参数呀,难道跟 metaspace 扩容无关。其实不然,CMSClassUnloadingEnabled 默认就是 true 呢。
// Check again if the space is available.  Another thread
  // may have similarly failed a metadata allocation and induced
  // a GC that freed space for the allocation.
  if (!MetadataAllocationFailALot) {
    _result = _loader_data->metaspace_non_null()->allocate(_size, _mdtype);
  }

  if (_result == NULL) {
    if (UseConcMarkSweepGC) {
      if (CMSClassUnloadingEnabled) {
        MetaspaceGC::set_should_concurrent_collect(true);
      }
      // For CMS expand since the collection is going to be concurrent.
      _result =
        _loader_data->metaspace_non_null()->expand_and_allocate(_size, _mdtype);
    }
其实日志中也是有蛛丝马迹的,只是不容易发现,以下是夹在 CMS GC 过程中的两段 Young GC 日志,可以看到日志中,metaspace 的 capacity 从 32762K 到 60333K,这也说明了,metaspace 在扩容。
Young GC 日志
第一次 Young GC 日志:
{Heap before GC invocations=0 (full 1):
 par new generation   total 1930304K, used 1846400K [0x0000000680600000, 0x00000006fb500000, 0x00000006fb500000)
  eden space 1846400K, 100% used [0x0000000680600000, 0x00000006f1120000, 0x00000006f1120000)
  from space 83904K,   0% used [0x00000006f1120000, 0x00000006f1120000, 0x00000006f6310000)
  to   space 83904K,   0% used [0x00000006f6310000, 0x00000006f6310000, 0x00000006fb500000)
 concurrent mark-sweep generation total 3222528K, used 0K [0x00000006fb500000, 0x00000007c0000000, 0x00000007c0000000)
 Metaspace       used 32159K, capacity 32762K, committed 33172K, reserved 1079296K
  class space    used 3979K, capacity 4274K, committed 4312K, reserved 1048576K
2019-07-16T16:45:00.420+0800: 12.596: [GC (Allocation Failure)[ParNew
Desired survivor size 42958848 bytes, new threshold 15 (max 15)
- age   1:   36618400 bytes,   36618400 total
: 1846400K->35858K(1930304K), 0.0408140 secs] 1846400K->35858K(5152832K)[Times: user=0.13 sys=0.02, real=0.05 secs]
Heap after GC invocations=1 (full 1):
 par new generation   total 1930304K, used 35858K [0x0000000680600000, 0x00000006fb500000, 0x00000006fb500000)
  eden space 1846400K,   0% used [0x0000000680600000, 0x0000000680600000, 0x00000006f1120000)
  from space 83904K,  42% used [0x00000006f6310000, 0x00000006f8614ac0, 0x00000006fb500000)
  to   space 83904K,   0% used [0x00000006f1120000, 0x00000006f1120000, 0x00000006f6310000)
 concurrent mark-sweep generation total 3222528K, used 0K [0x00000006fb500000, 0x00000007c0000000, 0x00000007c0000000)
 Metaspace       used 32159K, capacity 32762K, committed 33172K, reserved 1079296K
  class space    used 3979K, capacity 4274K, committed 4312K, reserved 1048576K
}
第二次 Young GC:
{Heap before GC invocations=1 (full 2):
 par new generation   total 1930304K, used 1882258K [0x0000000680600000, 0x00000006fb500000, 0x00000006fb500000)
  eden space 1846400K, 100% used [0x0000000680600000, 0x00000006f1120000, 0x00000006f1120000)
  from space 83904K,  42% used [0x00000006f6310000, 0x00000006f8614ac0, 0x00000006fb500000)
  to   space 83904K,   0% used [0x00000006f1120000, 0x00000006f1120000, 0x00000006f6310000)
 concurrent mark-sweep generation total 3222528K, used 0K [0x00000006fb500000, 0x00000007c0000000, 0x00000007c0000000)
 Metaspace       used 58703K, capacity 60333K, committed 60588K, reserved 1101824K
  class space    used 7085K, capacity 7578K, committed 7664K, reserved 1048576K
2019-07-16T16:45:53.020+0800: 65.196: [GC (Allocation Failure)[ParNew
Desired survivor size 42958848 bytes, new threshold 1 (max 15)
- age   1:   62204096 bytes,   62204096 total
- age   2:   13370728 bytes,   75574824 total
: 1882258K->79755K(1930304K), 0.0500188 secs] 1882258K->79755K(5152832K)[Times: user=0.14 sys=0.01, real=0.05 secs]
Heap after GC invocations=2 (full 2):
 par new generation   total 1930304K, used 79755K [0x0000000680600000, 0x00000006fb500000, 0x00000006fb500000)
  eden space 1846400K,   0% used [0x0000000680600000, 0x0000000680600000, 0x00000006f1120000)
  from space 83904K,  95% used [0x00000006f1120000, 0x00000006f5f02d90, 0x00000006f6310000)
  to   space 83904K,   0% used [0x00000006f6310000, 0x00000006f6310000, 0x00000006fb500000)
 concurrent mark-sweep generation total 3222528K, used 0K [0x00000006fb500000, 0x00000007c0000000, 0x00000007c0000000)
 Metaspace       used 58703K, capacity 60333K, committed 60588K, reserved 1101824K
  class space    used 7085K, capacity 7578K, committed 7664K, reserved 1048576K
}
因此,这是一次因 Metaspace 扩容导致的 CMS GC。
4.解决
既然是 Metaspace 扩容导致的,我们应该避免这种情况发生。那怎么避免呢?指定个大小吧。
大家都知道 jdk8 Metaspace 替代了之前的 Perm Gen,Metaspace 的最大大小,也就是 MaxMetaspaceSize 默认基本是无穷大,也就是它会充分利用操作系统能提供的最大大小。
但是初始大小是多大呢?主要由 MetaspaceSize 参数控制,默认 20.8M 左右(x86 下开启 c2 模式),非常小,它控制 metaspaceGC 发生的初始阈值,也是最小阈值。
关于初始大小,有兴趣的可以计算下 (16*13⁄10)M = 20.8M。
// Heap related flags
define_pd_global(uintx,MetaspaceSize,    ScaleForWordSize(16*M));

#ifdef _LP64
#define ScaleForWordSize(x) align_size_down_((x) * 13 / 10, HeapWordSize)
#else
#define ScaleForWordSize(x) (x)
#endif
因此,最终设置下这两个参数大小,问题就解决啦。
-XX:MetaspaceSize=256m -XX:MaxMetaspaceSize=256m
5.总结
在服务运行过程中,总会遇到奇奇怪怪得 GC 问题。关键是理清 GC 的脉络,做到成竹在胸,自然总能找到蛛丝马迹,从而定位并解决问题。另外,规范化 JVM 参数配置是避免诡异 GC 问题一个重要方法。
涤生的博客。
转载请注明原创出处,谢谢!
欢迎关注我的微信公众号:「涤生的博客」,获取更多技术分享。


Share this post
Twitter
Google+
Facebook
Reddit
LinkedIn
StumbleUpon
Pinterest
Email